Live data access
Connect REST, WebSocket, MQTT, databases, and test APIs, then map fields to charts, equipment states, and alerts.
了解更多Connect live systems, compose industrial views, publish dashboards, and deliver editable runtime packages from one workspace.
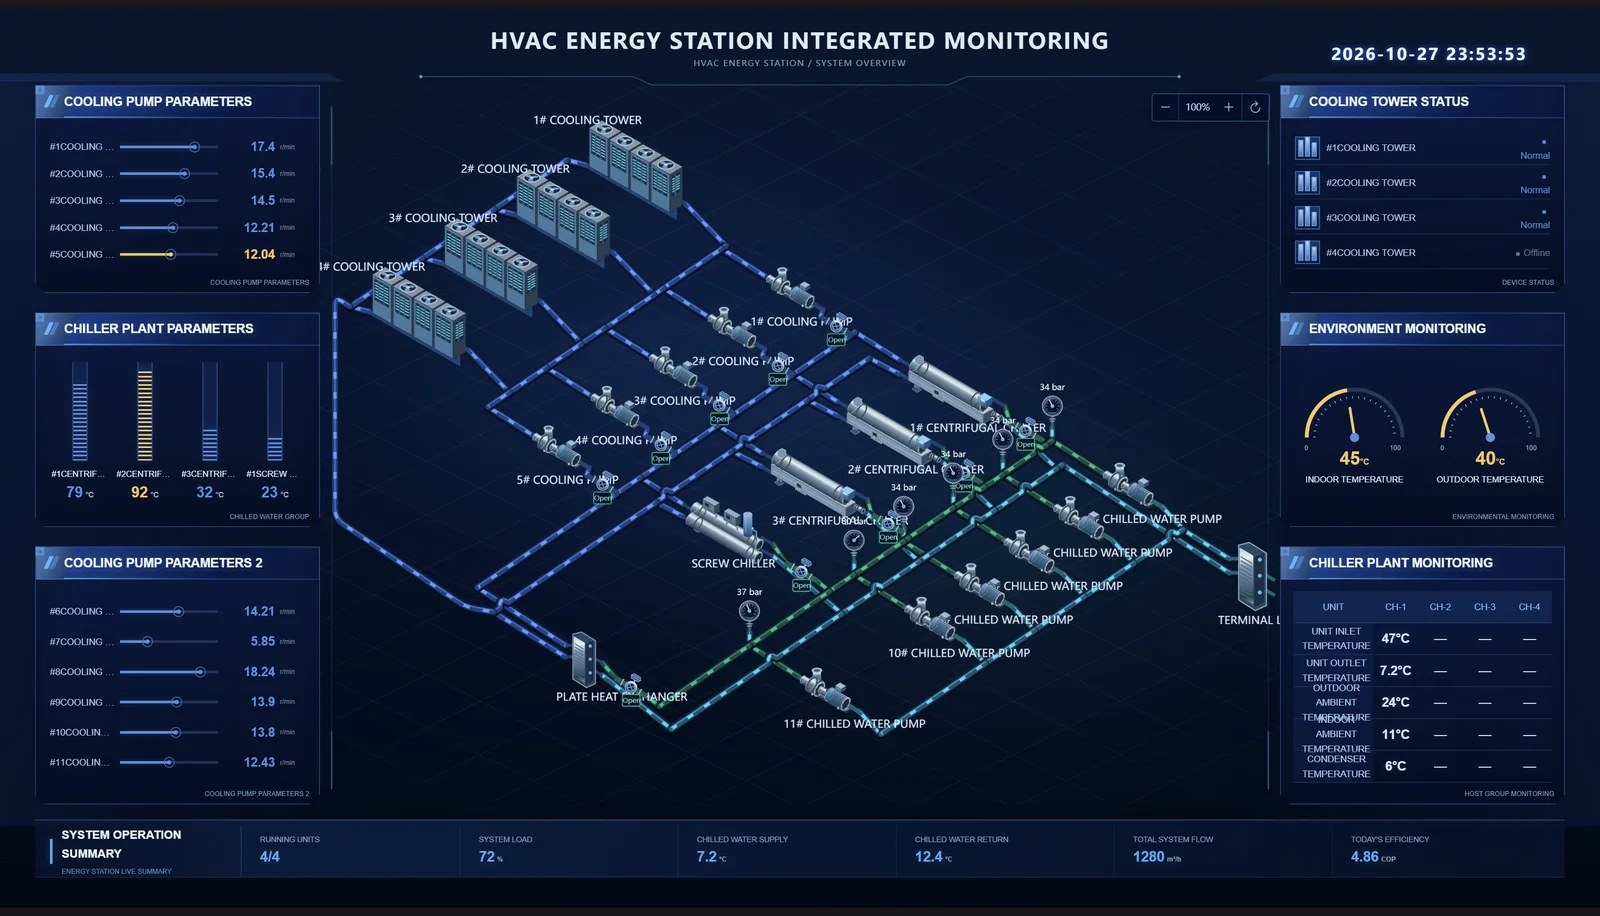
SmartBoard keeps data access, visual composition, reusable assets, publishing, and delivery in one connected workflow.
Connect REST, WebSocket, MQTT, databases, and test APIs, then map fields to charts, equipment states, and alerts.
了解更多Build production, energy, HVAC, water, and process views with reusable equipment, pipe, valve, gauge, and chart components.
了解更多Use drag and drop, layout guides, properties, layers, backgrounds, and component states to build maintainable screens.
了解更多Generate a dashboard structure or refine selected content in natural language. Review AI output before publishing.
了解更多Keep drafts and published snapshots separate and provide independent preview links to operations teams.
了解更多Export an editable project package for controlled local deployment and long-term maintenance.
了解更多Define equipment, business systems, metrics, states, alerts, and refresh intervals.
Use industrial assets and charts to organize information around the real operation.
Publish a standalone dashboard and plan data refresh, access, backup, and offline delivery.
Create a project and put the information your operations team needs onto one canvas.